
Start Here
Spotlight Feature: Patient Recruitment
Dashboard
Virtual Population
Study Design & Analysis
Decision Criteria
Simulation Results
Start Here

Welcome to the KerusCloud Playground.
Lorem ipsum dolor sit amet, consectetur adipiscing elit. Vivamus scelerisque eget urna id laoreet. Suspendisse suscipit odio ut velit feugiat.
Lorem ipsum dolor sit amet, consectetur adipiscing elit. Vivamus scelerisque eget urna id laoreet. Suspendisse suscipit odio ut velit feugiat.
Take a tour of KerusCloud’s features and try out the interactive results section for yourself.
Please note that, due to the density of the information displayed, this works best on larger screens.
Click on one of the topic areas to the left to start a tour.
Click on one of the topic areas to the left to start a tour.
Click on one of the topic areas to the left to start a tour.
Spotlight Feature: Patient Recruitment

KerusCloud allows recruitment rates to vary by site and time, allowing recruitment profiles to be simulated in line with expectation and not subject to, potentially unrealistic, simplification.

As recruitment profiles are often subject to significant uncertainty in advance of a trial initiating, KerusCloud allows generation of a number of recruitment profiles for simulation to explore a range of plausible scenarios.

Recruitment profiles can be stratified by site, allowing for faster or slower recruitment rates in different sites, perhaps based off previous experience or disease prevalence in a given region.

Recruitment profiles can be stratified by period, allowing for faster of slower recruitment rates depending on how long recruitment has been active for.
Dashboard

The project dashboard gives you an overview of your simulation project, with three stages for user input, then areas to output results, visualise results on-screen and control project collaboration.

The Virtual Population provides the unique core to KerusCloud, where you can build multiple patient populations with realistic, inter-related data characteristics.

At the Study Design and Analysis stage you specify how participants will be sampled from your population and randomised to treatment groups. Select from a list of statistical analyses and designs to be performed on each of your virtual studies.

Finally, you define your Decision Criteria in terms of individual or combined statistics from your analysis.

Explore quality control results and visualisations to interrogate your Virtual Population data.

View results of your project via a summary heatmap where you can
drill down on individual result metrics to further explore the data.

You can export your Virtual Population and Decision Criteria data for use outside KerusCloud, as well as generating a PDF report for your project.

KerusCloud allows you to share projects with other users inside or outside your organisation to enable further collaboration.

View and export past Kerus Credit usage for your project.
Virtual Population

Start your project by specifying scenarios to allow you to simultaneously explore alternative assumptions, uncertainties and uncontrollable factors that impact your study outcome.

Identify variables of interest, select a distribution for each variable, and then enter parameters to define the distribution.

Specify correlations between variables – this is critical to ensuring the results reflect the reality of your disease area.

Make your data even more realistic by adding noise, missingness and truncation as well as options to handle missing data.

Define Estimand Conditions to specify which subjects will have their data updated when processing an Estimand.

Create Estimands on your variables to define how data will be handled in response to custom intercurrent events.

Input the size of the population and number of parallel simulations to run.

Review all your Virtual Population settings before creating your simulated data in the cloud.
Study Design & Analysis

Stipulate the sample sizes you are considering.

Investigate options for treatment arms and allocation ratios.

Build analysis strategies using a pre-built library of descriptive and comparative statistical methods. Multiple analysis options can be defined for all endpoints, strata and covariates.

Incorporate fixed and/or adaptive designs into your project from a pre-built library of design types.

Review the Study Design & Analysis options you have created prior to running them in parallel in the cloud.
Decision Criteria

Specify how you want to define success in terms of statistical significance or clinical, regulatory or commercial criteria.

Combine criteria as you wish to investigate potential different decision-making and development path options.

Review your selected Decision Criteria before submitting for cloud processing.
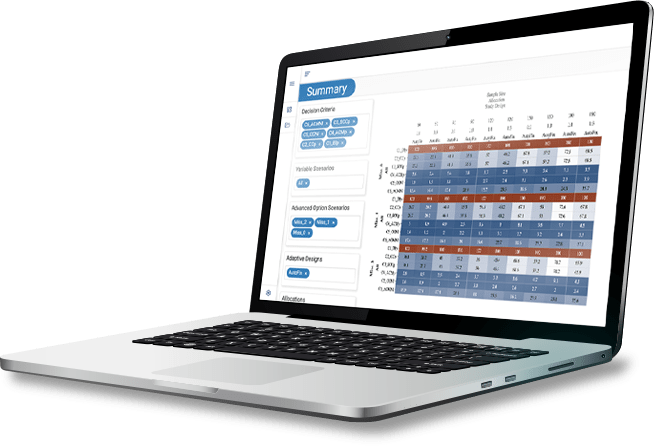
Simulation Results

View your interactive heatmap, which summarises the probability of achieving your success criteria for each of your different scenarios and different study design. Values above the target are coloured orange and those below in blue.

Subset the heatmap using the drop-down selection boxes on the left hand side.

Alter the probability of success threshold with the slider, choose a preferred colour scheme via the settings icon.

View detailed results by clicking a specfic metric in the heatmap to drill down for additional information.

Compare your requested values of variable parameters and correlations to their average values in your Virtual Population.

Visualise detailed QC results for specific parameters and correlations across simulations.
Sorry – you need a bigger screen!
Due to the complexity of the data shown in KerusCloud’s interactive heatmaps, this page can only be viewed on a large screen device. Please try again on a device with a monitor resolution of around 1920 x 1080 pixels.
Contact us now to book a call.
Contact us now to book a call.